FIT3179 Data visualisations
I had to make a couple of data visualisations over the course of the FIT3179 data visualisation unit I completed in Semester 2 2023.
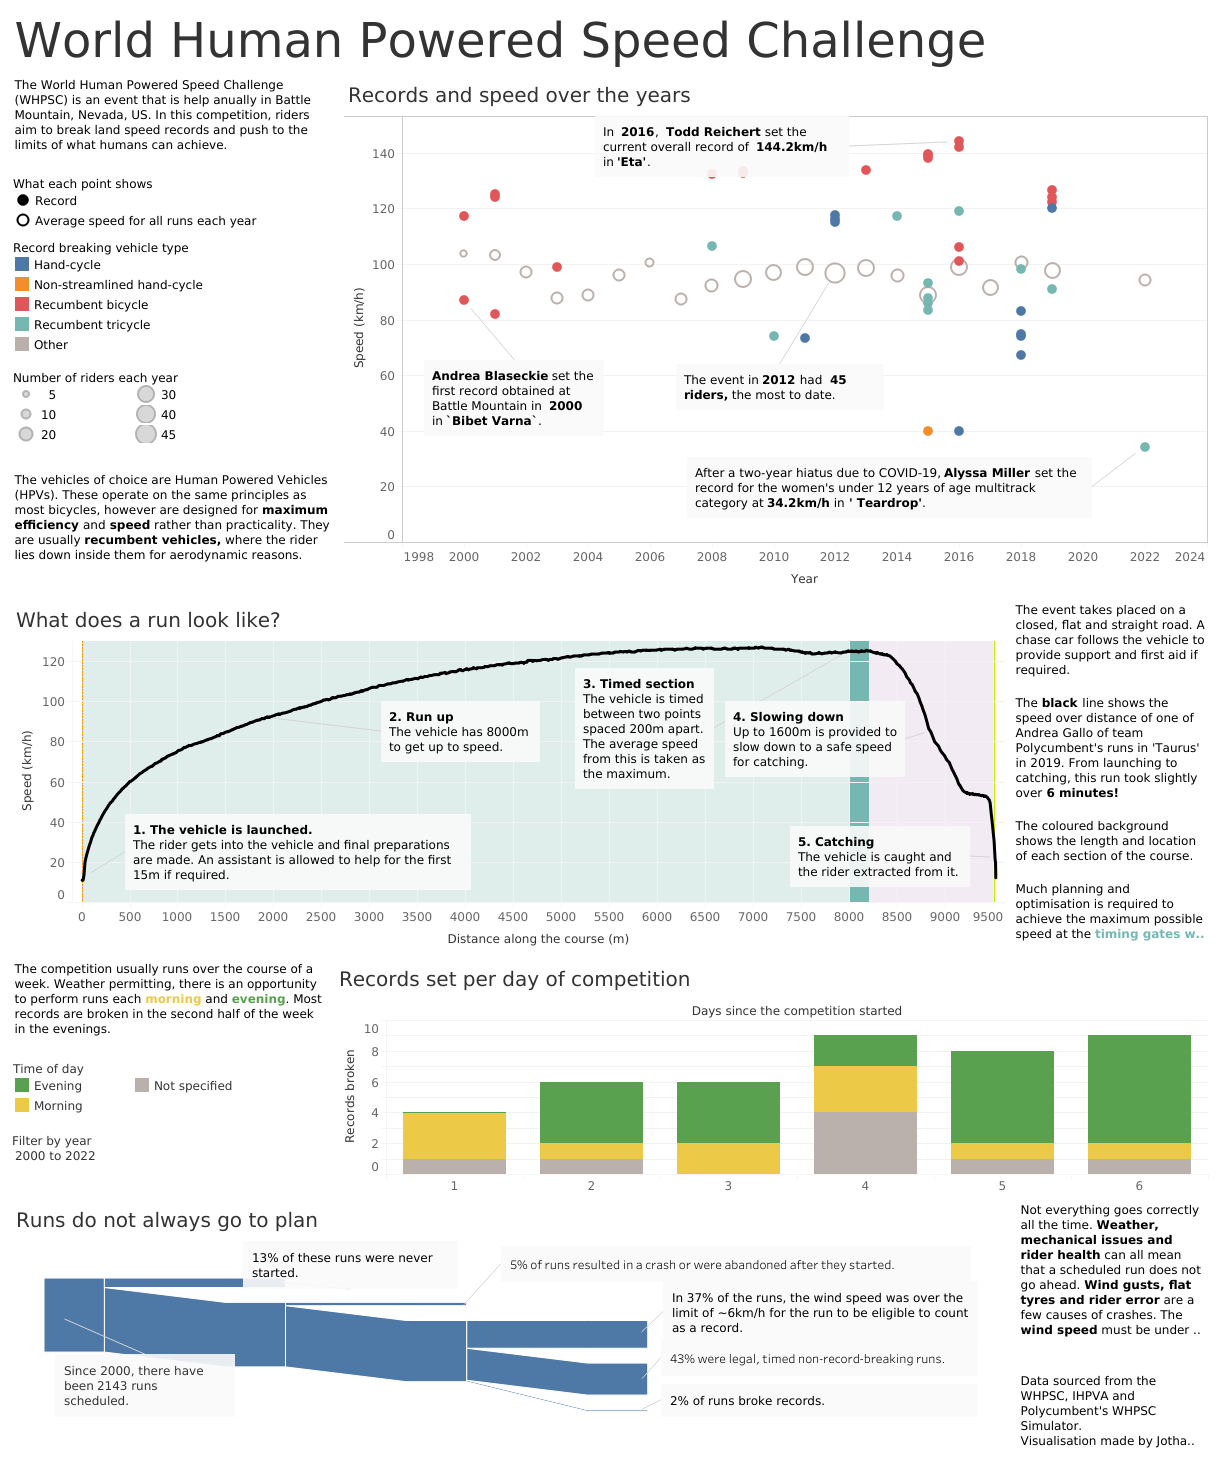
World Human Powered Speed Challenge
This visualisation was made using Tableau Public and can be accessed here.
2022 Northern Victoria Floods
This was done using Vega-Lite with some fairly tight deadlines.
FIT3179 (Git repository)
Jotham's repository for FIT3179 Data visualisation - S2 2023
The original page is here